Devotedly
Best prices, Best supporting
Professionally
The most Effective
Quality
Accompanying Customers
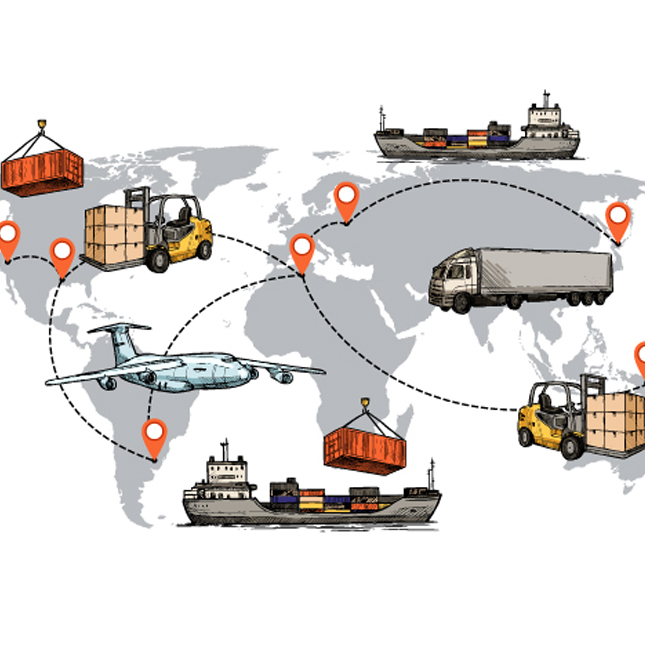
Your cargo, we connect beliefs
Hotline:0903.309.909
Devotedly
Best prices, Best supporting
Professionally
The most Effective
Quality
Accompanying Customers


Home >> News >> Vietnam’s Top 10 Exports
The eastern-most nation on Southeast Asia’s Indochina Peninsula, the Socialist Republic of Vietnam shipped an estimated US$290.4 billion worth of goods around the globe in 2018. That dollar amount reflects an 93.3% gain since 2014 and a 35.7% improvement from 2017 to 2018.

In addition, Vietnam furnished an estimated $15.1 billion worth of international services during 2018 encompassing about $10.3 billion from travel-related services.
From a continental perspective, 52.8% of Vietnam’s exported goods by value were delivered to fellow Asian countries while 21.8% were sold to North American importers. Vietnam shipped another 19.2% worth of goods to Europe. Smaller percentages went to Latin America excluding Mexico but including the Caribbean (2.4%), Oceania led by Australia (1.8%) then Africa (1.1%).
Given Vietnam’s population of 97 million people, its total $290.4 billion in 2018 exports translates to roughly $3,000 for every resident in the Southeast Asian nation.
Mục lục
The following export product groups represent the highest dollar value in Vietnamese global shipments during 2018. Also shown is the percentage share each export category represents in terms of overall exports from Vietnam.
Vietnam’s top 10 exports accounted for about three-quarters (74.7%) of the overall value of its global shipments.
Electrical machinery and equipment was the fastest-growing among the top 10 export categories, up by 56.4% year over year since 2017.
In second place for improving export sales was footwear thanks to its 49.7% increase.
Vietnam’s shipments of furniture, bedding, lighting, signs and prefabricated buildings posted the third-fastest gain in value up by 48.7% year over year.
The leading decliner among the top 10 Vietnam export categories was optical, technical and medical apparatus which fell -16.1%
From the more granular four-digit Harmonized Tariff System code level, phone system devices including smartphones represent Vietnam’s most valuable exported product at 23.1% of the country’s total. In second place were integrated circuits or microassemblies (5.8%) trailed by textile footwear (3.8%), TV, radio or radar device parts (3%), leather footwear (2.3%), miscellaneous furniture (2.1%), printing machinery (1.7%) insulated wire or cable (1.5%) rubber or plastic footwear (1.4%) then knitted or crocheted jerseys and pullovers (also 1.4%).
Overall, Vietnam posted a $32.2 billion trade surplus during 2018, up by 873.6% from the $3.3 billion in black ink one year earlier.
The following types of Vietnamese product shipments represent positive net exports or a trade balance surplus. Investopedia defines net exports as the value of a country’s total exports minus the value of its total imports.
In a nutshell, net exports represent the amount by which foreign spending on a home country’s goods or services exceeds or lags the home country’s spending on foreign goods or services.
Vietnam has highly positive net exports in the international trade of electrical machinery and equipment. In turn, these cashflows indicate Vietnam’s strong competitive advantages under the electrical products category.
Below are exports from Vietnam that result in negative net exports or product trade balance deficits. These negative net exports reveal product categories where foreign spending on home country Vietnam’s goods trail Vietnamese importer spending on foreign products.
Vietnam has highly negative net exports and therefore deep international trade deficits under the plastic materials and items made from plastics category.
Two Vietnamese corporations rank among Forbes Global 2000. One company, Vietin Bank is a regional bank.
The other large business, Petrovietnam Gas is part of the following list of Vietnamese international trade businesses:
Vietnam’s capital is Hanoi, a city nicknamed “Paris of the Orient” and “Paris of the East”.
In macroeconomic terms, Vietnam’s total exported goods represent 39.1% of its overall Gross Domestic Product for 2018 ($710.3 billion valued in Purchasing Power Parity US dollars). That 39.1% for exports to overall GDP in PPP for 2018 compares to 53.9% for 2014, seeming to indicate a relatively decreasing reliance on products sold on international markets for Vietnam’s total economic performance. And while this article focuses on exported goods, it is interesting to note that Vietnam also provided $15.1 billion worth of exports-related services to global customers for an additional 2.1% of GDP in PPP. These metrics include a significant amount of re-exporting activity.
Another key indicator of a country’s economic performance is its unemployment rate. Vietnam’s unemployment rate was 2.16% at June 2019 down from 2.2% one year earlier, according to Trading Economics.
Follow: Vietnam’s Top 10 Exports